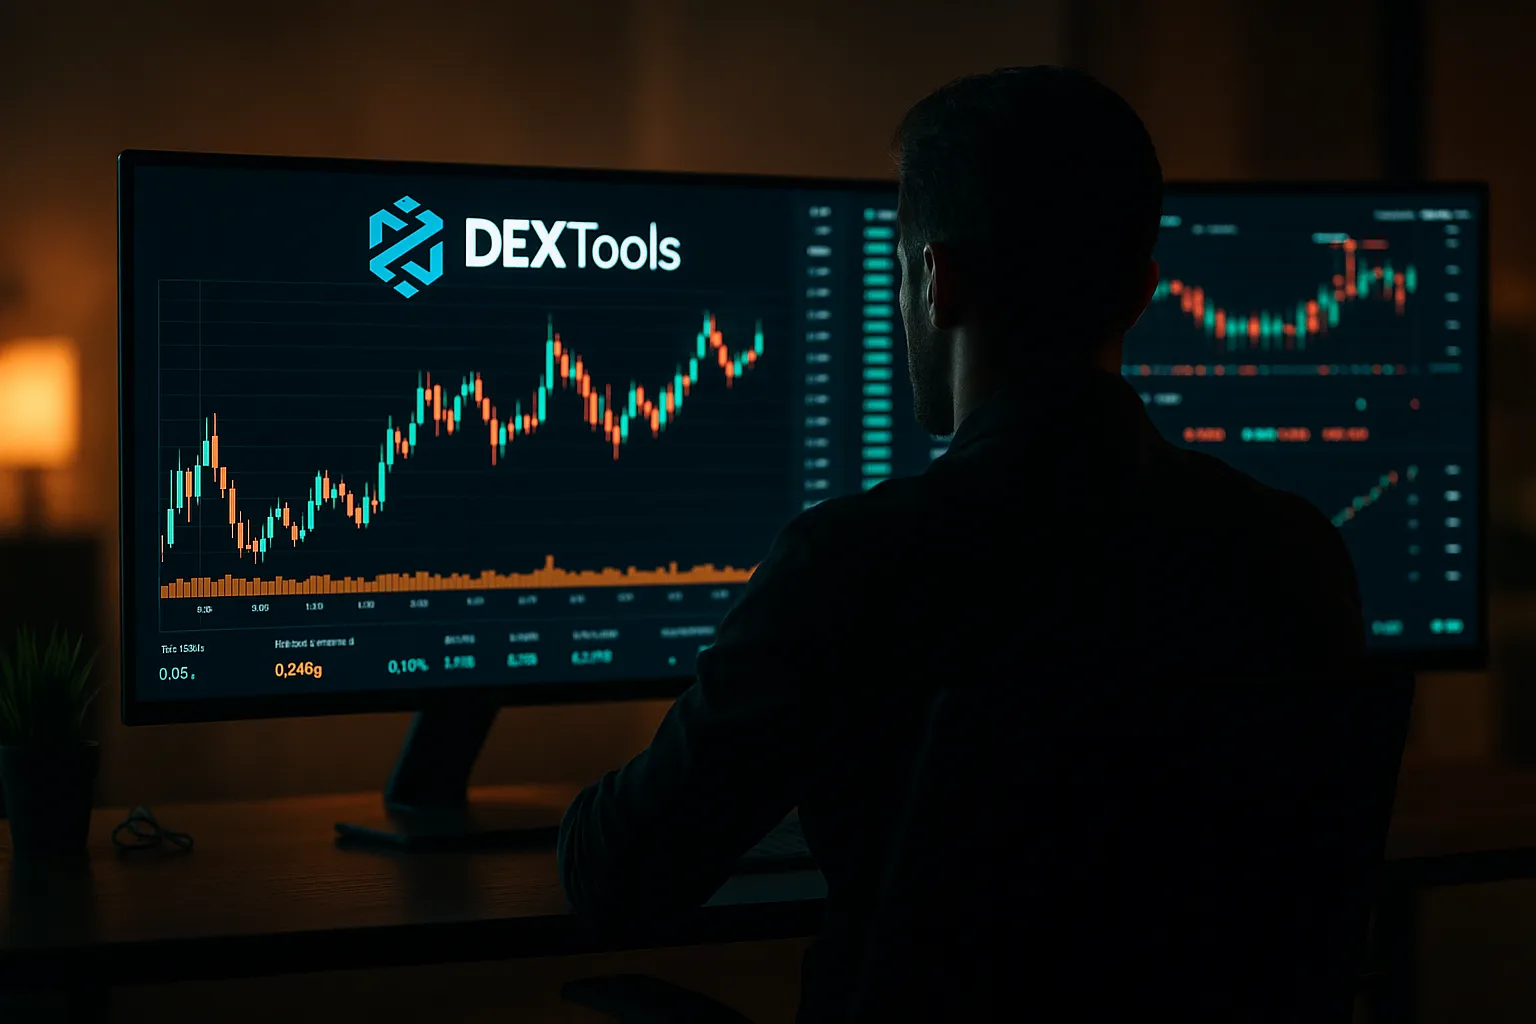
DEXTools’ Pair Explorer: Unearthing Hidden Gems in DeFi
Get Breaking News First!
Editor’s choice
-

🔐 One Wallet for Everything Is How Most Traders Get Hurt. Here Is How Many You Actually Need
-

💰 Don’t Sell Your Bitcoin – Borrow Against It: The Best Platforms in 2026
-
MetaMask Who? The Web3 Wallets Traders Are Actually Using in 2026
-

💼 When Crypto Trading Becomes a Business: The IRS Rules Every Active Trader Needs to Know
-
₿ Why Local Businesses Are Taking Bitcoin Seriously in 2026
-

⚡ The Best of Both Worlds: How Hybrid Crypto Exchanges Are Changing the Way We Trade
The world of Decentralized Finance (DeFi) is thrilling and filled with amazing opportunities. But that’s often accompanied by a dizzying amount of noise and risk. The harder you dig for hidden gems, the faster they seem to run from you.
Navigating this tricky industry demands powerful tools, and for many pros, DEXTools’ Pair Explorer is their primary weapon. This guide will show you how to leverage the DEXTools’ Pair Explorer to easily unearth great potential opportunities.You’ll never be late to the party again.
💥 What Is the DEXTools’s Pair Explorer?

While DEXTools offers many tools, the Pair Explorer is arguably where most users spend their time looking for the next TRUMP coin😅.
Join our community of 400K+ and never miss breaking news!
We respect and protect your privacy. By subscribing your info will be subject to our privacy policy . Unsubscribe easily at any time
The Pair Explorer lets you explore any token’s trading pools, offering real-time charts, reliability scores, and transaction histories.
Here’s how to make the most of this powerful tool:
- On the DEXTools homepage, you’ll find the Pair Explorer on the left-side menu. If you’re on mobile, tap the menu icon in the top-right corner and select “Pair Explorer.”
- To begin your search, type in the token symbol (e.g., ETH, CAKE, UNI) and select it from the suggested options. As you type, DEXTools will typically show matching pairs across various DEXs and chains. Choose the specific pair you want to investigate.
- For quicker results and to avoid knockoff tokens with similar names, it’s best to search using the token’s contract address. Copy the contract address from a trusted source, such as the project’s official website or reputable crypto tracking sites like CoinGecko, and paste it into the search bar.
- You can also connect your crypto wallet to enable you to trade without leaving the Pair Explorer. Find that option in the top-right corner of the Pair Explorer.
➗ Decoding the Key Metrics and Features Within the Pair Explorer and How to Interpret Them
💹 The Charts

The TradingView integration allows you to view your asset’s current performance and do your technical analysis. However, be ready to bump into some really weird, alien-shaped charts that will make your head spin. Literally😂.
Momentum indicators like RSI and MACD help spot potential reversals, so you can quickly exit trades (with profits this time and not just screenshots😂.)
Whether you’re looking for support levels with Fibonacci tools or waiting for breakouts with volume confirmation, you’ve got a full suite of professional-grade analysis features at your fingertips.
🔗 And while at it, here’s how you’ll find the next 100x Altcoins in 2025.
📊 Liquidity and Volume

At the heart of every trading pair are two metrics that can make or break your success: liquidity and volume.
Liquidity is the total value of assets locked in a pair’s pool. Think of it as your trade’s shock absorbers. The deeper the pool, the smoother your execution. High liquidity reduces slippage, letting you move larger amounts without rocking the price. With low liquidity, even small trades can cause big swings.
Volume reflects how much value has been traded in a given timeframe (like 24h). High volume signals active interest, while low volume often means the pair is stale or illiquid.
Volume spikes paired with price moves are key indicators. Strong volume with an uptrend signals buying pressure; strong volume on a downtrend signals potential panic selling.
🚩 Red flag alert: Sudden volume spikes without liquidity growth usually mean manipulation or a pump-and-dump. One minute you’re riding a breakout, the next… 5, 4, 3, $0 😂
✅ Your best bet? Focus on pairs with gradually rising liquidity and consistent volume trends, not just short-lived hype.
Join our community of 400K+ and never miss breaking news!
We respect and protect your privacy. By subscribing your info will be subject to our privacy policy . Unsubscribe easily at any time
Check the liquidity lock icon on the left-hand menu in DEXTools. If it’s green, liquidity is locked. Click it to see more details about the token’s security.
⚠️ And watch out for pairs with tiny market caps and massive daily volume,like a $1M cap and $50M volume. That’s often a sign of wash trading or fake liquidity, not real demand.
Volume should ideally be somewhat proportionate to the project’s size. Look for volume that seems realistic for the project’s stage and market capitalization. Even better, learn top risk management techniques to help avoid getting rekt.
🤼 Holder Information

The holder data reveals who’s really pulling the strings behind a token. You can find it on the section below the coin’s chart, under the “Holders” option.
When you analyze holder data, you’re looking for healthy decentralization. This means the token is spread across many wallets, with no single holder owning an overly dominant percentage.
A well-distributed token is less likely to be manipulated by a single entity dumping large amounts to control the price. However, this isn’t a foolproof guarantee.
🚩Red flags to watch for include:
Think of it like a neighborhood: you’d rather have hundreds of homeowners than one landlord controlling everything, right😏?
📈 Transaction Feed

The transaction feed is your backstage pass to the real drama. It lets you see buy and sell orders in real-time, helping you spot trends or any suspicious activity 👀.
You’ll spot whales making waves with massive orders, sneaky bots running their repetitive schemes, and genuine traders building positions.
When you see consistent large buys, it could mean smart money’s accumulating. Or, someone’s trying to create the illusion of positive momentum.
Also, those persistent sells could be normal profit-taking, or (yikes!) a whale dumping in the trenches😆.
So, watch out for unusual wallet activity, suspicious trade timing, and volume spikes that don’t quite add up. Cross-reference everything with liquidity levels.
🔐 Trust Score and Security Audits

DEXTools often provides a “Trust Score” (based on their internal algorithm evaluating various factors like liquidity, holder distribution, contract analysis) and security audit links.
Think of it as your BS detector on steroids helping you separate the gems from the garbage🚮.
A low score is a major red flag. A high score is positive but still needs further investigation.
Security audits are reviews of the token’s underlying smart contract by third-party firms to find vulnerabilities. Finding links to reputable audits within DEXTools (and verifying them externally) is a great way to avoid rug pulls. However, even audited contracts can have bugs or exploits, and audits don’t assess the team’s intentions.
Scroll down the left pane to view the trust score and check audits.
And to get even better insights, learn how to use Google Trends in crypto trading.
🏁 Final Thoughts
You’re now ready to be a master degen and catch those elusive moonshots before they take off. Extra tip: research a coin’s developers. Anonymous devs like “SafeMoonLambo” don’t exactly inspire confidence, right?
Be smart and dig into the team. Who are they? Do they have relevant experience? Look for LinkedIn profiles, past projects, and public statements. While an anonymous team isn’t always a red flag, it does add more risk, especially with newer projects.
To stay ahead in the evolving crypto world with expert insights, become part of our community of 20,000+ traders and investors. Get started by subscribing to our weekly newsletter and joining our Telegram channel.