🕯️ Candlestick Charts 101: Stop Guessing, Start Reading
Get Breaking News First!
Editor’s choice
-
🕯️ Candlestick Charts 101: Stop Guessing, Start Reading
-

💸 The Evolution of DeFi: From Yield Farming Chaos to Real-World Power Plays
-

HODL, FUD, & FOMO: A Beginner’s Guide to Crypto Slang 🧠
-

How to Start Swing Trading Crypto: A Beginner’s Guide
-

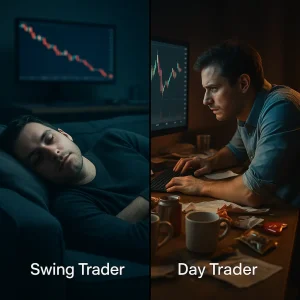
Crypto Swing vs. Day Trading: Match Strategy to Your Risk Style
-

Nancy Pelosi’s $270M Net Worth Exposes How Politics Prints Money
Candlestick charts are where technical analysis truly begins.
Each tiny box and line packs alpha — open, close, highs, lows, sentiment, and momentum shifts — all at a glance. Yet for most beginners, they might as well be hieroglyphs.
Let’s change that.
Join our community of 400K+ and never miss breaking news!
We respect and protect your privacy. By subscribing your info will be subject to our privacy policy . Unsubscribe easily at any time
This guide breaks down what candlesticks are, how to read them, and why patterns like Doji, Hammer, and Engulfing matter.
If you’re new to trading crypto, consider this your chart-reading cheat code.
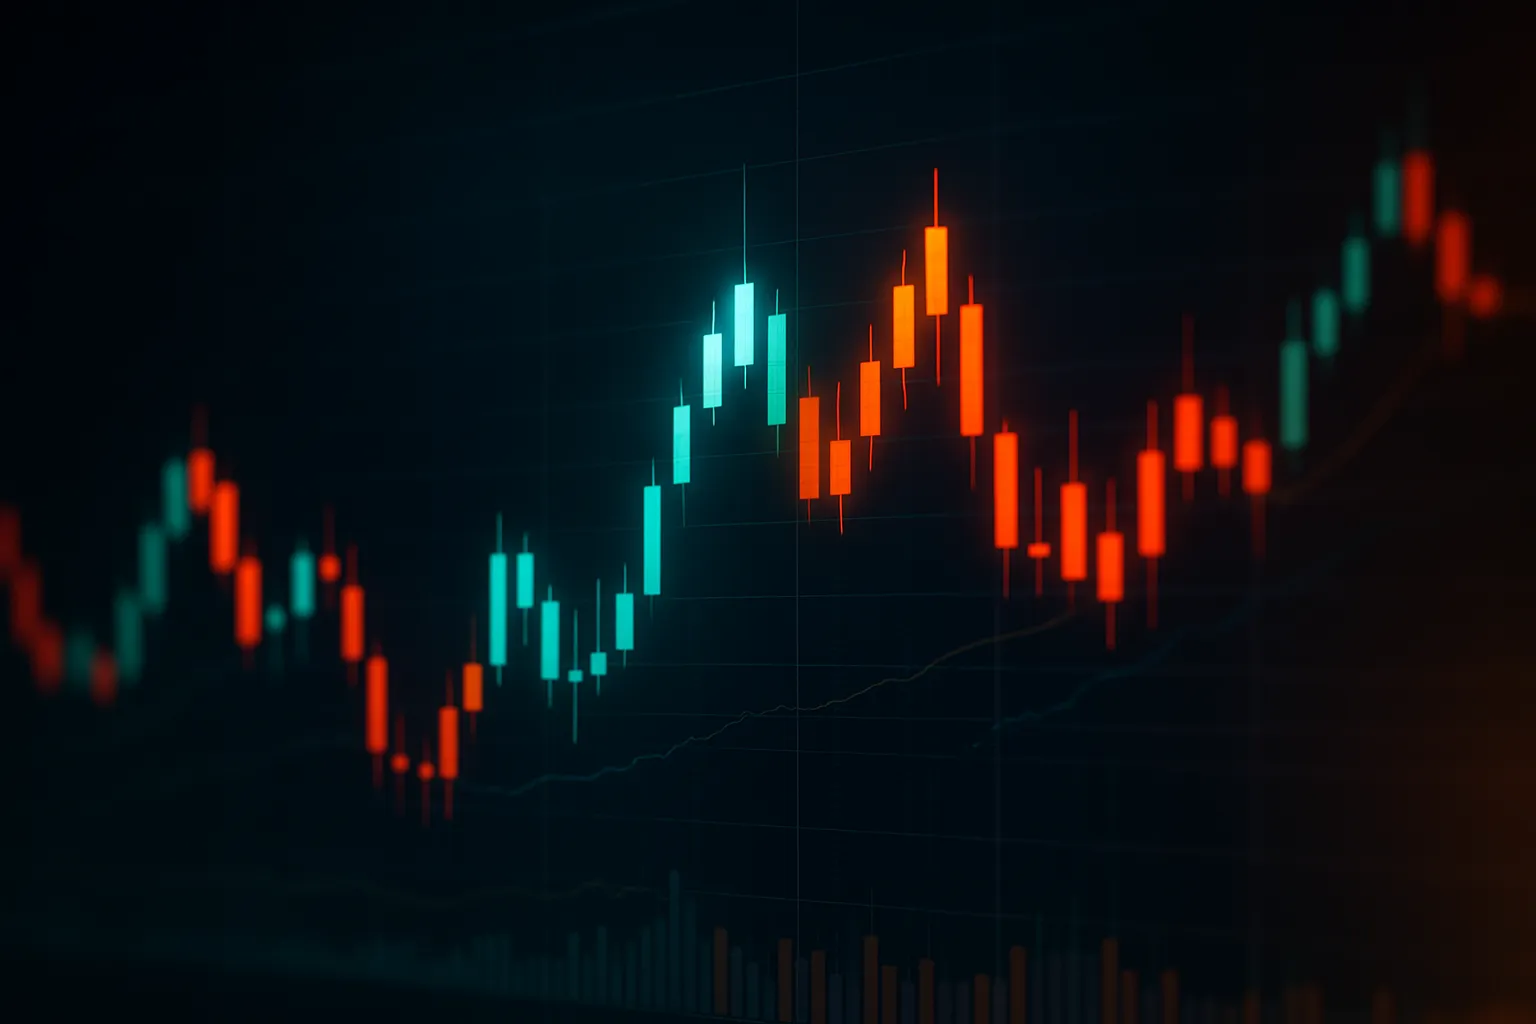
Anatomy of a Candle

Each candlestick shows price action over a set period — whether that’s 1 minute, 5 minutes, an hour, or a day.
Quick reads:
Must-Know Candlestick Patterns
Doji 🌌
A Doji forms when the open and close prices are almost identical — meaning buyers and sellers battled, but no one won.
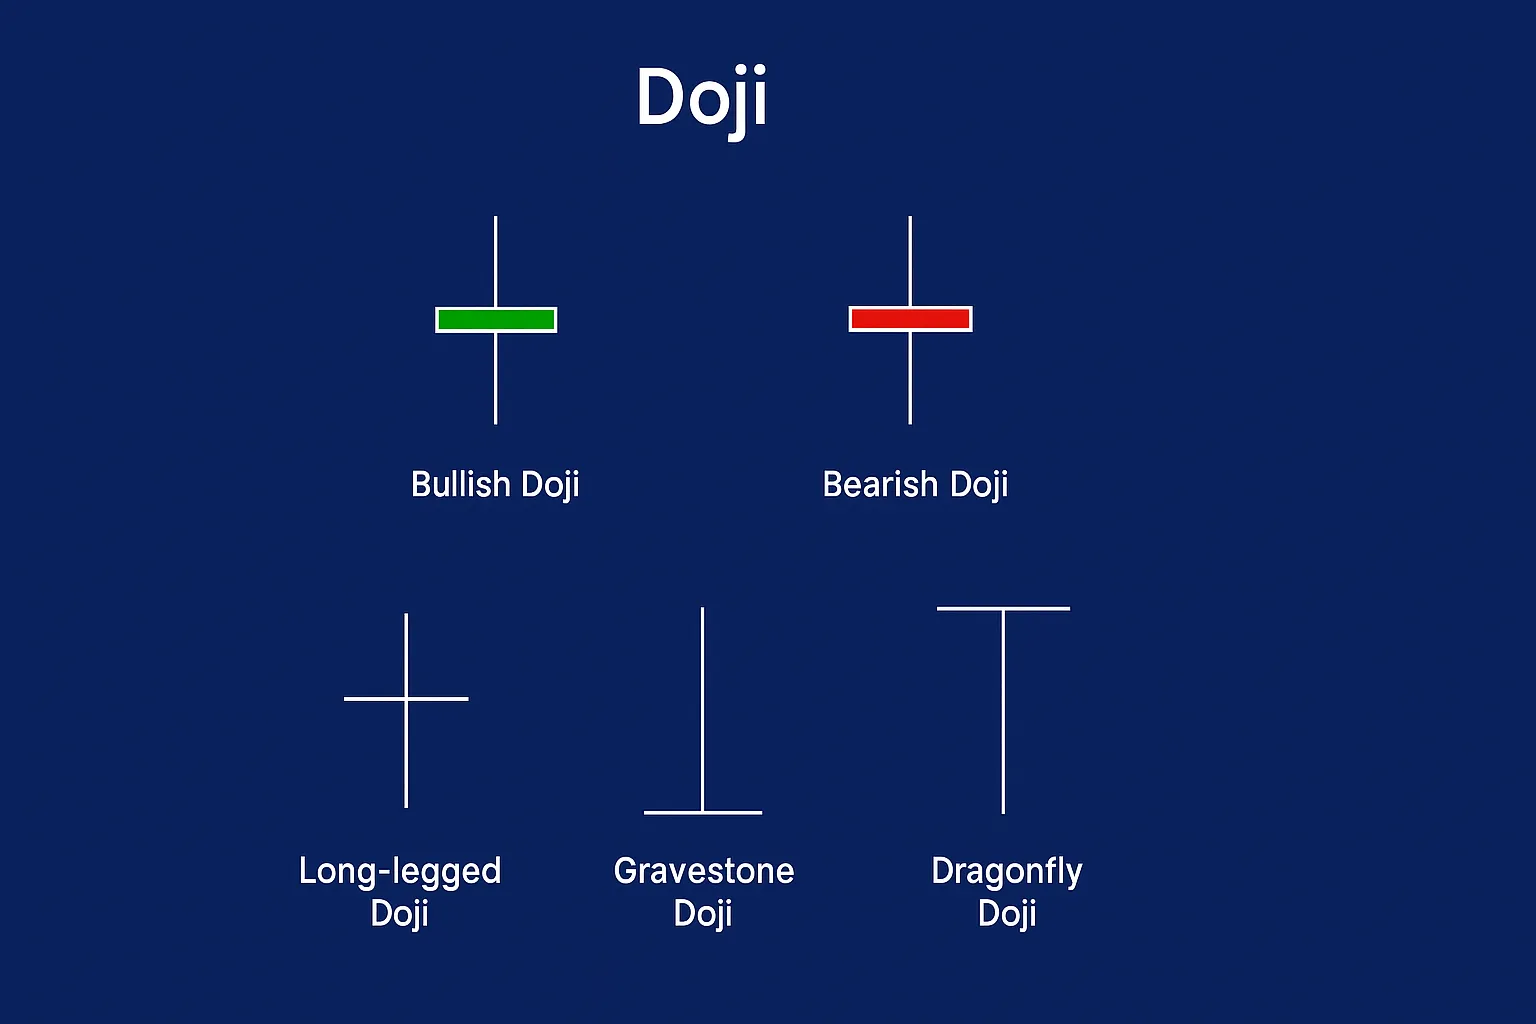
Image source: Forex.com
Types of Doji:
Hammer 🔨
A single-candle pattern with a small body near the top and a long lower wick.
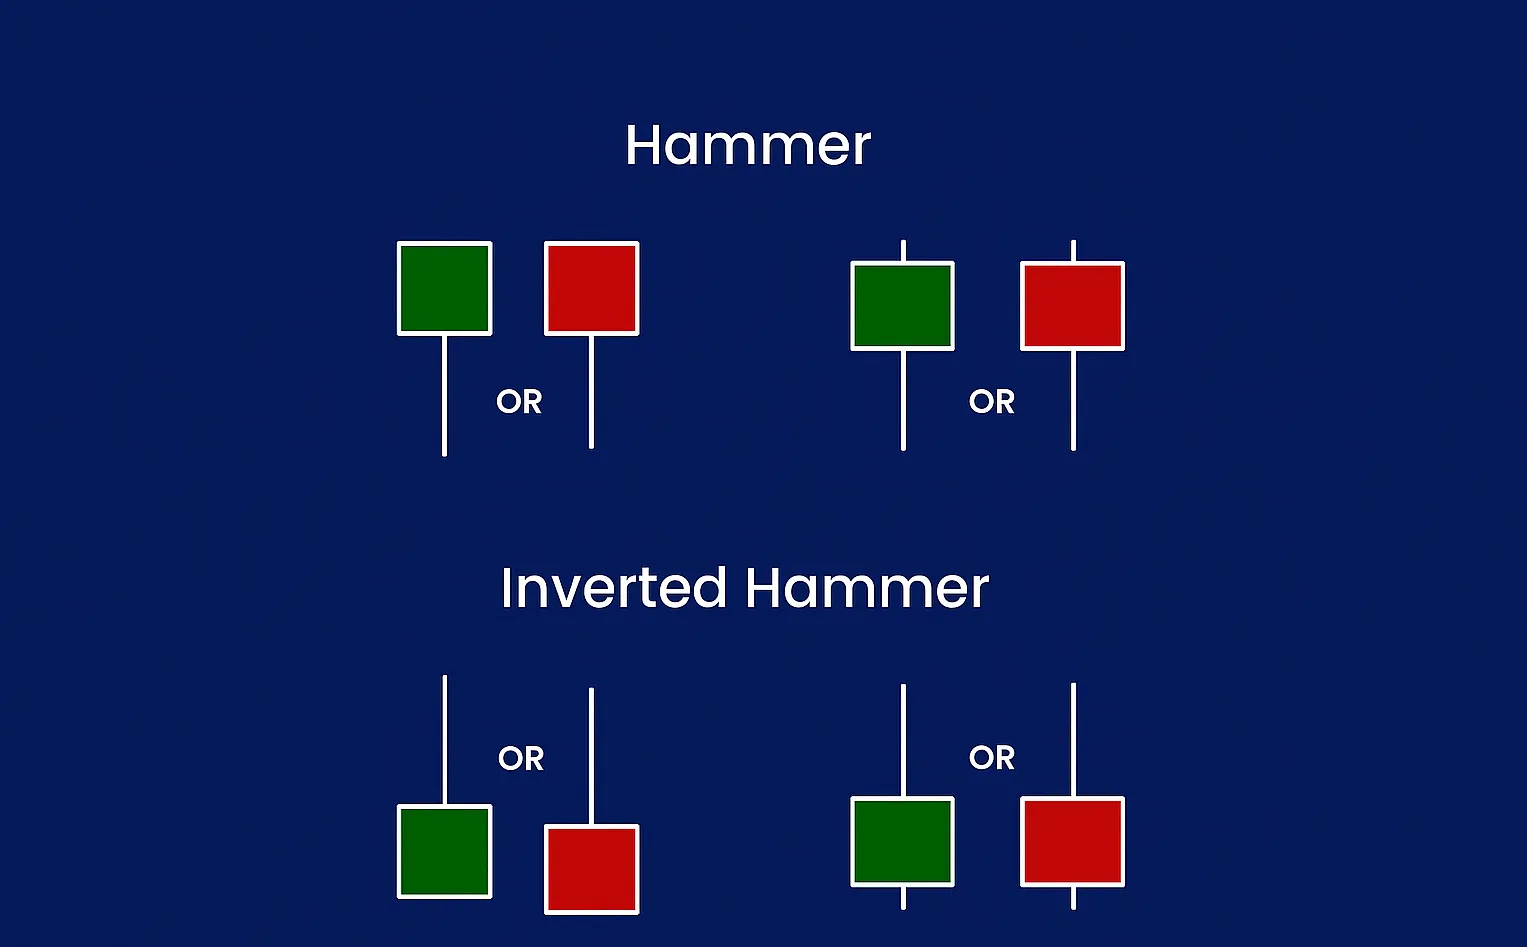
Image source: Forex.com
👉 Watch out: An Inverted Hammer (same structure, but wick on top) is also bullish in a downtrend, but needs stronger confirmation.
Engulfing 🤯
An Engulfing pattern is made up of two candles, and the second one completely swallows the first. It’s a clear signal that momentum just flipped sides.
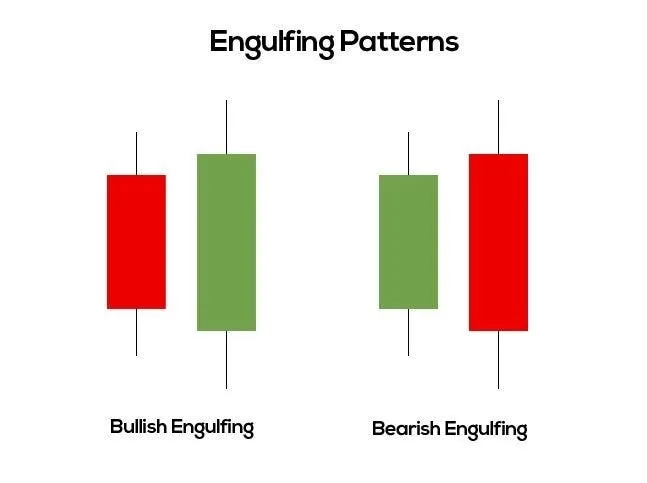
Image source: Medium.com
💡 Pro tip: The bigger the engulfing candle compared to the first, the stronger the reversal signal.
Patterns Need Context

No pattern is an island.
That Doji? It means nothing if it’s floating in chop.
Join our community of 400K+ and never miss breaking news!
We respect and protect your privacy. By subscribing your info will be subject to our privacy policy . Unsubscribe easily at any time
That Hammer? Useless in a sideways market. Patterns are tools, not signals to YOLO.
Here’s what makes a pattern trustworthy:
Check out our on-chain data guide for how to pair patterns with network insights.
Real Chart Example
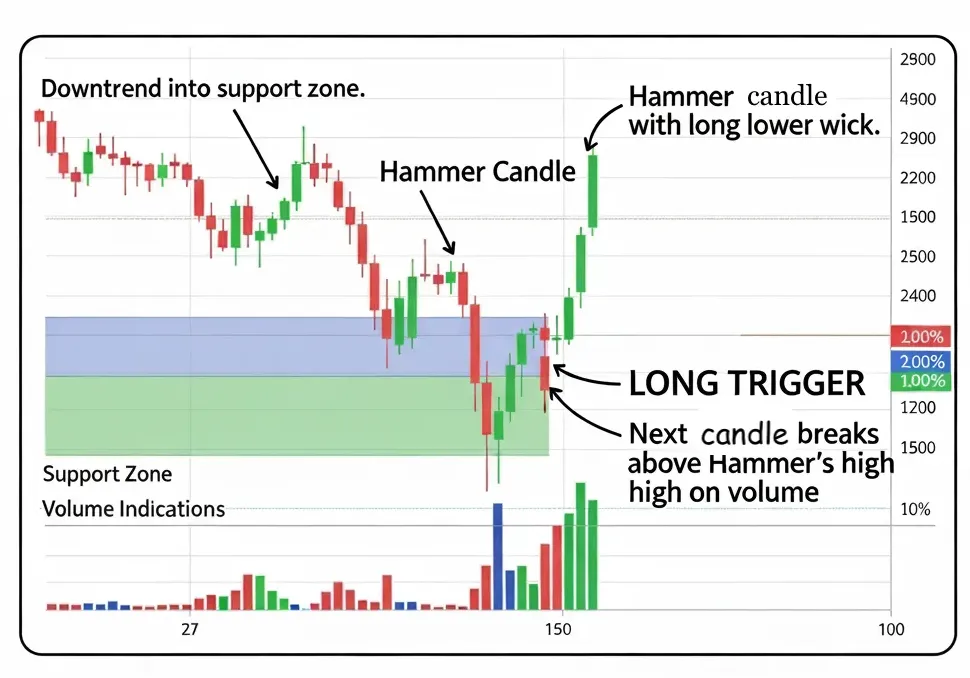
Visual learners, here’s how it looks in the wild:
- Downtrend into support zone.
- Hammer candle prints with long lower wick.
- Next candle breaks above Hammer’s high on volume.
That’s a long trigger.
Now imagine the same setup in an illiquid micro-cap. Be cautious. As we covered in our piece on crypto liquidity black holes, pattern reliability drops when books are thin.
Quick Reference Table
| Pattern | Signal Type | Looks Like | Best Context |
|---|---|---|---|
| Doji | Neutral | Small body, long wicks. | After trend, near levels. |
| Hammer | Bullish | Small body, long lower wick. | After downtrend. |
| Inverted Hammer | Bullish | Small body, long upper wick. | After downtrend. |
| Bullish Engulfing | Bullish | Big green wraps small red candle. | After pullback. |
| Bearish Engulfing | Bearish | Big red wraps small green candle. | After rally. |
Learn to Read Candlesticks for An Edge Against Most Traders
Candlesticks aren’t magic, but they’re a cheat code once you learn to read them in context.
Don’t just memorize shapes, interpret the story they tell.
Want to go deeper? Learn how to build a bulletproof crypto portfolio using candlestick signals, on-chain data, and risk-aware entries.
Stay sharp, trade smarter.
🔗 Join our Telegram of 20K+ traders and get the newsletter that actually helps you make money.